A Chinese langugage teacher’s developmental trajectory
Learning outcomes
| < Back |
The graphs below illustrate how the changes in students’ engagement in the discussion correspond to the changes in Tim’s pedagogical design.
|
| |
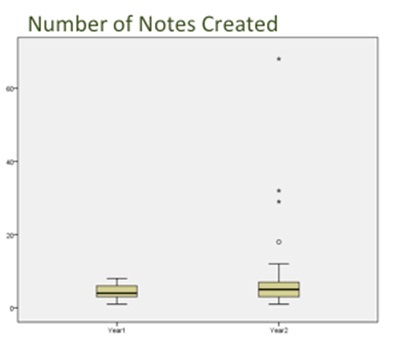 Figure 1. Number of notes created |
There was an increase in the number of notes created by many students in the second year, with several individuals creating more than 20 notes (Fig. 1). This shows the contributions made by students were uneven. |
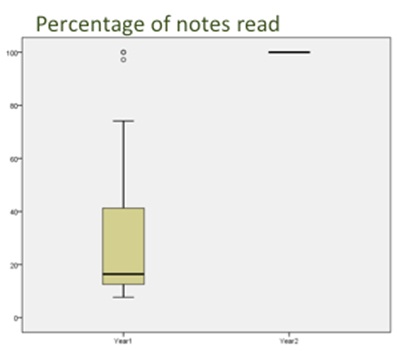 Figure 2. Percentage of notes read |
In Year 2, the majority of the class read all of the notes (100%) compared to a much lower percentage in the previous year (Fig. 2). It can be seen that the number of notes created and percentage of notes read had increased in the second year, which shows that students’ engagement in the online discourse had improved. |
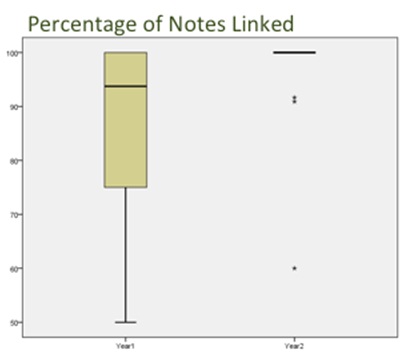 Figure 3. Percentage of notes linked |
Additionally, there was a drastic improvement in the number of notes being linked (100%) in the second year (Fig. 3). This shows that all students who participated in the discussion in Year 2 had attempted to connect ideas. |
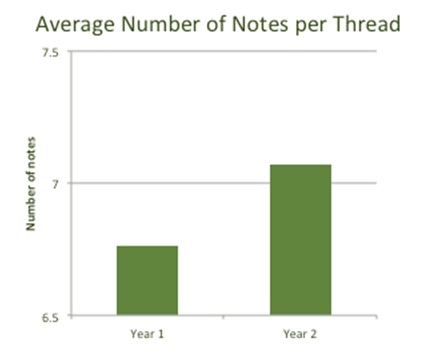 Figure 4. Average number of notes per thread |
There was also a substantial rise in the average number of notes per thread in Year 2, suggesting students’ ability to build on seed notes had improved to some extent (Fig. 4). This further shows that students were connecting ideas and willing to contribute in the process of knowledge advancement as a member of the community. |
 Figure 5. Number of scaffolds used |
A few students also utilised more scaffolds in the second year (Fig. 5). However, the median number of scaffolds used remained at a similar level across the two years. |
|
| |
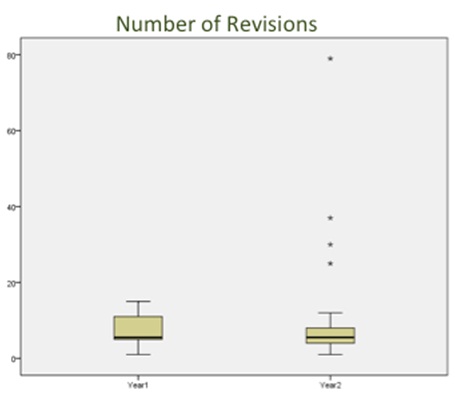 Figure 6. Number of note revisions |
Some of the students made more revisions in Year 2 (Fig. 6). Revisions include adding new information, and clarifying or refining existing ideas. This shows that students were working continuously to improve ideas. |
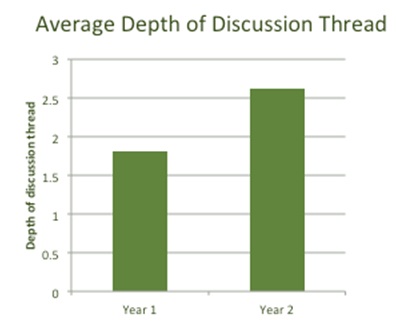 Figure 7. Average depth of discussion thread |
On average, the class had more depth to their online discussions in terms of add-on notes in the second year compared to the first (Fig. 7). This shows that students were offering, connecting, and expanding ideas. |
|
| |
 Figure 8. Number/ types of questions between the two years |
Teachers can tell whether there is any advancement in the students’ higher order thinking skills by looking at the question types and how they frame their questions. Presence of various inquiry question types was higher in the second year compared to the first (Fig. 8). Verification and reason questions were two most common question types in the second year while that of the first year were verification and attribute. |
| < Back |